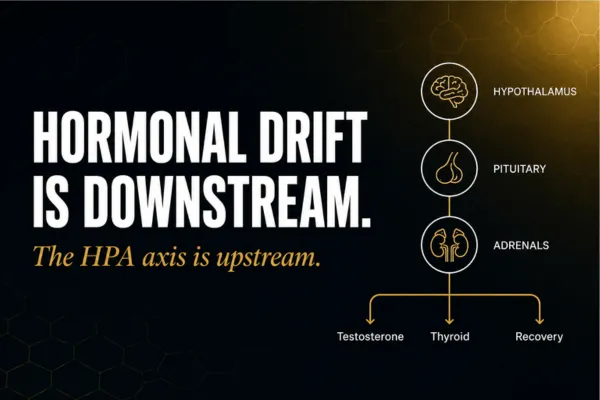
Hormonal Drift Is Downstream. The HPA Axis Is Upstream.
Hormones don't crash. They drift. And when testosterone, cortisol, and thyroid drift together, the upstream cause is almost never the gland itself. It's the HPA (Hypothalamic-Pituitary-Adrenal) axis under chronic load.
That distinction matters because the standard workup treats each gland as an independent question. Testosterone low? Look at the testes. Thyroid sluggish? Look at the thyroid. Cortisol off? Look at the adrenals. The labs come back inside the reference range, the question is closed, and the patient is told to wait and see.
The patient is right. Something's wrong. The model is wrong.
Disease is the endpoint. Decline is the runway. The Performance Gap is what we measure on the runway
Drift, not failure
Glands rarely fail acutely in high-output adults. What happens is slower and quieter. Output stays consistent. The internal regulatory environment erodes. 12 to 36 months later, three labs are simultaneously in the bottom quartile of reference range, and no one can point to the cause because no one was looking upstream.
The clinical signature of drift is not a single low number. It's the pattern of low-normals moving in concert. Testosterone at 420. Free T3 at the floor. Morning cortisol blunted. SHBG creeping up. Each marker is individually defensible. Together, they describe a system compensating for a regulatory load that no one has named.
This is the gap between disease and decline. Disease is the endpoint, the moment a marker crosses a threshold and earns a diagnosis. Decline is the runway, the years before that during which the system is loaded but still performing. The Performance Gap is what we measure on the runway.
The HPA axis as the upstream regulator
The hypothalamic-pituitary-adrenal axis is the system that translates stress, real or perceived, into hormonal output. It's not just an "adrenal" story. The HPA axis is a feedback loop that integrates psychological load, physical training, sleep deprivation, inflammatory signaling, and metabolic stress into a single regulatory signal: how much cortisol to produce, and when.
Under acute stress, the system works elegantly. Cortisol spikes, mobilizes glucose, sharpens cognition, and returns to baseline. Under chronic load, the arc breaks down. The system moves through three identifiable stages:
Elevated. Cortisol output is high across the day. The diurnal curve loses its morning peak and evening trough. Subjective experience: wired, sleep-onset insomnia, anxious edge under output.
Dysregulated. Total output is variable. The curve is flattened or inverted. Mornings are sluggish, evenings are wired. Recovery from training is degraded. Subjective experience: "tired but wired," middle-of-the-night wakings, declining stress tolerance.
Blunted. Total cortisol output is low. Morning rise is absent. The system has down-regulated to protect itself from chronic activation. Subjective experience: low motivation, exercise intolerance, slow recovery, low stress capacity. Often misread as depression.
Most high performers spend years in Stage 1 and Stage 2 before Stage 3 is unmistakable. None of these stages will show up on a single morning serum cortisol drawn at a routine physical.

How the downstream drift happens
Once the HPA axis is loaded, downstream endocrine drift is not coincidence. It's the predictable consequence of a system reallocating resources.
Testosterone. Chronic cortisol elevation suppresses testosterone synthesis through several pathways: direct suppression of testicular Leydig cell function, suppression at the hypothalamic level (GnRH), and competition for upstream substrate. The classical "pregnenolone steal" hypothesis, which proposes that pregnenolone is preferentially shunted toward cortisol synthesis at the expense of DHEA and downstream sex hormones, is debated at the mechanistic level. The cleaner statement is this: under chronic HPA activation, the body prioritizes cortisol, and sex-hormone output is reliably suppressed. The mechanism is multifactorial. The clinical pattern is consistent.
Thyroid. Most thyroid labs measure TSH and T4. The performance-relevant question is conversion: how much T4 is being converted to active free T3, and how much is being shunted to reverse T3 (an inactive isomer that takes up the same receptor). Cortisol suppresses peripheral deiodinase activity, the enzyme family responsible for T4-to-T3 conversion. Under chronic HPA load, you can have a perfectly acceptable TSH and T4, and a free T3 sitting at the bottom of range with reverse T3 climbing. The thyroid gland is fine. The conversion environment is not.
SHBG and free testosterone. Sex hormone-binding globulin rises under chronic stress, insulin resistance, and hepatic load. A total testosterone of 600 with an SHBG of 55 yields a free testosterone that is functionally low. The standard panel reports total T. The picture is incomplete.
The shared upstream is the same in every case: the HPA axis.
Why "low-normal" is a misleading floor
Reference ranges are derived from population studies. Those populations include sedentary adults, older adults, and metabolically compromised individuals. The range is built to flag pathology, not to describe optimal function in a high-output 42-year-old.
A testosterone of 420 in a forty-something professional is in the bottom quartile of a population that includes people thirty years older and substantially less metabolically healthy. That is not a clean bill of health. It's a low-quartile result in a range that should not have applied in the first place.
The same logic applies across the panel. Free T3 at the bottom of range is not "normal" if the question is performance. Morning cortisol at the bottom of range is not "normal" if the question is whether the HPA axis still mounts a normal diurnal response.
The standard panel was built to find disease. You're asking about decline. Those are not the same question.
What an HPA-led hormonal panel actually measures
A panel designed to map drift, rather than confirm or rule out disease, looks structurally different.
Diurnal cortisol curve. Four-point salivary or dried urine cortisol across the day. A single morning serum cortisol level cannot capture the arc.
DHEA-S. The other adrenal output. A low DHEA-S in the presence of dysregulated cortisol is a stronger signal of axis fatigue than either marker alone.
Free testosterone with SHBG. Total T is incomplete data. Free T contextualized by SHBG is the actionable number.
Free T3, free T4, reverse T3, TSH. The conversion picture, not just the gland output.
Autonomic markers. Heart rate variability over time, resting heart rate trend, and sleep architecture, if available. The autonomic nervous system is the real-time read on regulatory load. It contextualizes the labs.
This is not a "more is better" panel. It's a panel built around the question. The question is whether the regulatory environment is supporting the output, or quietly subsidizing it.
Hormones don't crash. They drift. And the drift is governed upstream.
If your testosterone, cortisol, and thyroid are all sitting at the bottom of range, and your panels keep coming back "in range," you're not failing at three systems independently. You're watching one system fail upstream, and the rest compensate.
The Performance Gap Webinar on Saturday May 30 walks the full four-pillar map: how metabolic buffering, ANS balance, HPA axis regulation, and structural resilience interact, and what a panel built around the question actually looks like.
[Register for the Performance Gap Webinar — Sat May 30, 10am CT]
P.S. If you want to know where your own gap is before the webinar, the Performance Gap Diagnostic ($275) pairs the symptom burden inventory with a functional blood chemistry read. It is the same workup the webinar is built around.
Vgontzas AN et al. "Adverse effects of modest sleep restriction on sleepiness, performance, and inflammatory cytokines." J Clin Endocrinol Metab. 2004 — sleep restriction and IL-6 / HPA activation.
McEwen BS. "Physiology and neurobiology of stress and adaptation: central role of the brain." Physiol Rev. 2007 — allostatic load and HPA axis dysregulation.
Chrousos GP. "Stress and disorders of the stress system." Nat Rev Endocrinol. 2009 — HPA axis as upstream regulator of endocrine drift.
Mongioì LM et al. "The role of free T3 to free T4 ratio in subclinical thyroid dysfunction." Citations on T4 to T3 conversion under cortisol load.
Cumming DC, Quigley ME, Yen SS. "Acute suppression of circulating testosterone levels by cortisol in men." J Clin Endocrinol Metab. 1983 — cortisol's direct suppressive effect on testosterone, often cited in the pregnenolone-steal discussion. Note the clinical debate honestly: the classical "steal" model is contested at the mechanistic level, but the downstream observation (cortisol up, testosterone down under chronic stress) is well-documented.